
Key Headlines
- National sales rose 11.8% in July to 240,311 units, recovering from a June dip caused almost entirely by dealer demonstrator clearance ahead of the financial year end.
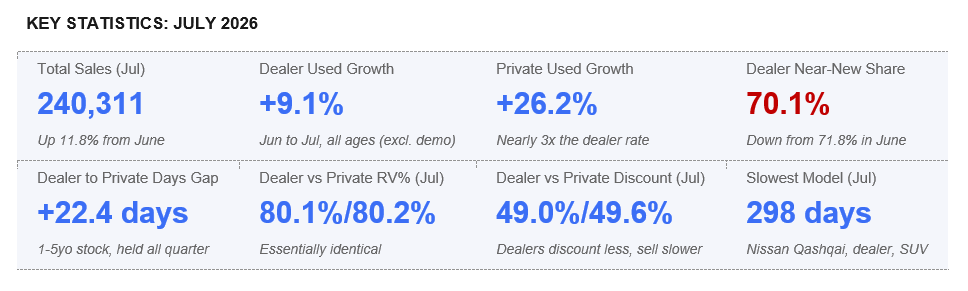
- Dealer used volume grew a healthy 9.1% in July. Private seller volume grew 26.2%, roughly three times faster. Dealer share of the near-new used market slipped from 71.8% to 70.1% in a month.
- Dealers are taking around 22 more days than private sellers to sell equivalent 1 to 5-year-old vehicles, despite discounting less frequently and less deeply.
Market Snapshot and the EOFY Demo Effect
Australia’s used vehicle market rebounded strongly in July after a softer June, with national sales rising to 240,311 vehicles.
New data from the Australian Automotive Dealer Association (AADA) and AutoGrab shows the June decline was largely the result of end-of-financial-year demonstrator clearance activity rather than weaker underlying demand.
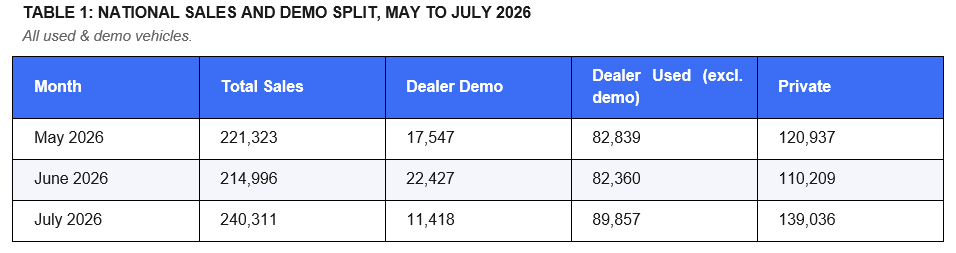
June’s 2.9% sales dip was not a demand story. It was a dealer demonstrator stock effect: dealers clear demo fleets ahead of the June 30 financial year end. Demo sales spiked from 17,547 in May to 22,427 in June, then collapsed to 11,418 in July, a fall of 49%. Genuine dealer used stock, excluding demo, held broadly flat through the demo spike (82,839 in May, 82,360 in June) before growing 9.1% in July to 89,857.
Dealers Selling More but Losing Market Share
While dealers increased used vehicle sales during July, private sellers grew at almost three times the rate.
Dealer used vehicle sales increased 9.1 per cent compared with June, while private seller sales rose 26.2 per cent.
Private sellers recorded stronger growth than dealers across every vehicle age category, despite dealers continuing to dominate the near-new segment.
The two channels remain structurally different businesses: 42% of dealer volume in July was 0-4 years old versus 10% for private sellers, while 61% of private volume was 11 years or older versus 24% for dealer.
General Market Statistics
- 240,311 vehicles sold in July, an 11.8% increase on June.
- 437,855 vehicles listed for sale in July, a 13% increase month on month.
- Dealers accounted for 42.1% of the sales for the month.
- Average days to sell jumped out to 52.1 for July, the highest point for the year.
- Dealers achieved broadly the same retained values as private sellers while discounting less frequently and less deeply
Reaction
“The July rebound shows the June decline was largely a seasonal effect driven by end-of-financial-year demonstrator clearances rather than any softening in underlying demand,” said AADA CEO James Voortman.
“It’s encouraging to see dealers increase used vehicle sales during July. However, private sellers grew at a much faster rate, highlighting the competitive conditions across the used vehicle market.”
“The data also shows dealers are continuing to achieve similar retained values to private sellers while discounting less often. That suggests slower stock turnover is being influenced by broader market dynamics rather than pricing alone,” he said.
“Supply grew a little faster than demand in July. There were 437,855 vehicles advertised for sale, up 13 per cent on June, against 240,311 sold, up 11.8 per cent. The average vehicle took 52.1 days to sell, the longest of the year so far. A market can be busy and slow at the same time, and in July it was both,” said AutoGrab Chief Commercial Officer Saxon Odgers.
“The private channel is the larger half of this market. Dealers accounted for 42.1 per cent of July sales; private sellers moved 139,036 vehicles, close to 58 per cent of the total. Private sellers have held the larger share in each of the past three months, and that share widened again in July.”
“The days-to-sell gap barely moved across the quarter. Dealers took around 22 more days than private sellers to sell equivalent one to five-year-old stock in May, again in June and again in July. The consistency is the finding here, not the size of the gap. Three months at the same spread is a settled pattern rather than a one-month result,” he said.